I Intercepted 3,177 API Calls Across 4 AI Coding Tools. Here's What's Actually Filling Your Context Window.
Last week I asked Claude to fix a one-line bug. It used 23,000 tokens. Then I asked Gemini to fix the same bug. It used 350,000 tokens. Yeah I couldn’t just let that slide.
So I built Context Lens, a context tracer that intercepts LLM API calls and shows you what’s actually in the context window, broken down per turn. I pointed it at four coding tools, gave them all the same job, and the results were different enough that I figured I should write them up.
The question
We pay for tokens when using these models. Tokens are, well, complicated. They are basically pieces of information; 1 token is roughly 4 characters in English text. The more tokens that go to a model, the more you pay.
But more importantly, tokens make up the context of a model. The context is everything that a model has when generating a response, like its short term memory. And just like in humans, it’s limited. And the more you have to remember, the worse you get when asked a detailed question.
So we have to be careful with our context window, and the tokens that we use to build up the window. My question was, how do tools handle this limitation? Are they intelligent about it, or not?
The setup
I have a bunch of experiments planned, and this is the first one. It’s a little artificial, but bear with me.
I planted a bug in Express.js: a reordered null check in res.send() that causes res.send(null) to return the string "null" with content-type: application/json instead of an empty body. I used the real Express repo with 6,128 commits of history. I committed the bug, so it’s sitting right there.
Each tool gets the same prompt:
There’s a bug report: when calling
res.send(null), the response body is the string “null” with content-type application/json, instead of an empty body. This was working before. Find and fix the bug. Verify your fix by running the test suite.
The models I used:
| CLI | Model | Context window | Input $/1M tokens | Output $/1M tokens |
|---|---|---|---|---|
| Claude Code | Claude Opus 4.6 | 200K | $5.00 | $25.00 |
| Claude Code | Claude Sonnet 4.5 | 200K | $3.00 | $15.00 |
| Codex CLI | GPT-5.3 Codex | 200K | $2.50 | $10.00 |
| Gemini CLI | Gemini 2.5 Pro | 1M | $1.25 | $10.00 |
All four solved the bug and all 1,246 tests passed. Same outcome, but different journey.
The comparison
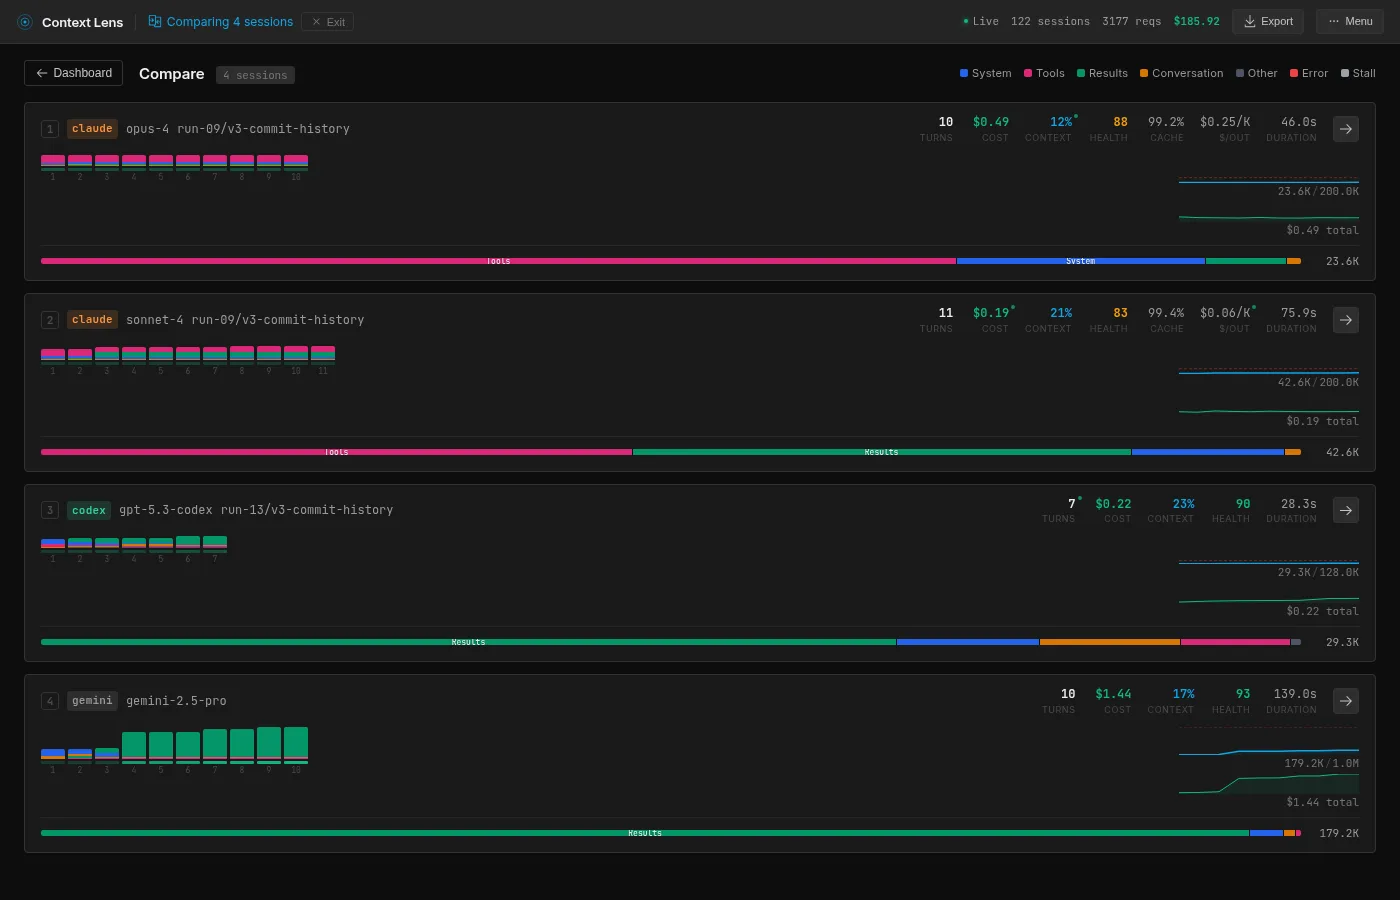
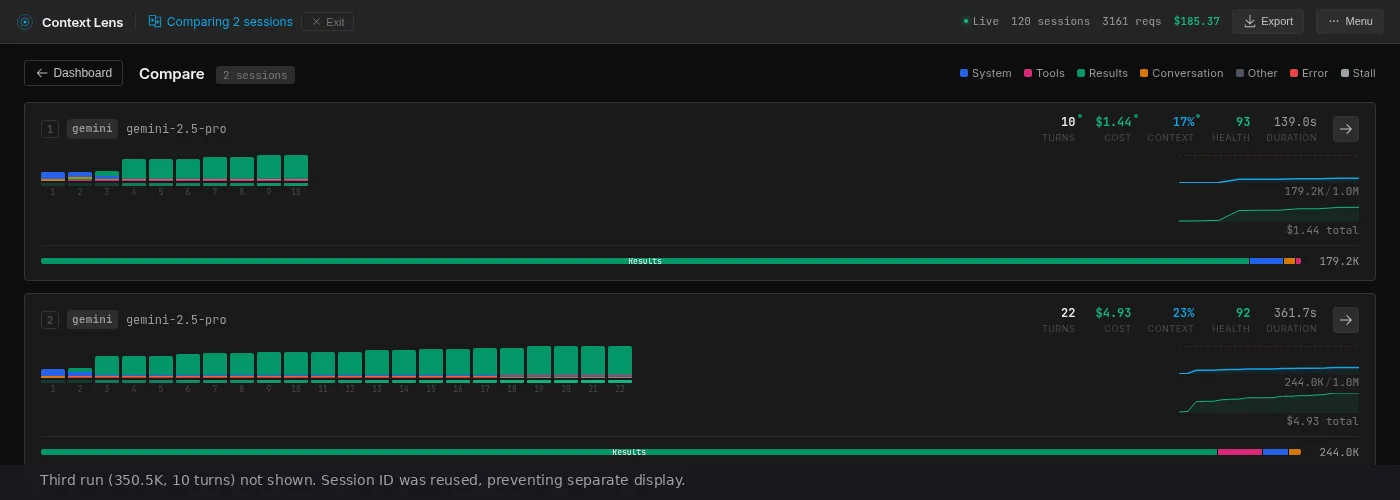
Here’s what Context Lens shows when you put the best run of each four models side by side:
The composition bar at the bottom of each card is the interesting bit, mainly the fact that they are all completely different. Pink is tool definitions, green is tool results, blue is system prompt and orange is the conversation with the user.
I ran each tool multiple times (resetting the repo between runs, waiting for an appropriate time for cache to cool down) to check whether the numbers are stable:
| Tool | Runs | Mean | Std Dev | Min | Max |
|---|---|---|---|---|---|
| Opus 4.6 | 4 | 27.0K | 5.5K | 23.6K | 35.2K |
| Sonnet 4.5 | 4 | 49.9K | 13.1K | 42.6K | 69.6K |
| Codex (GPT-5.3) | 4 | 35.2K | 8.1K | 29.3K | 47.2K |
| Gemini 2.5 Pro | 3 | 257.9K | 86.5K | 179.2K | 350.5K |
Ok, Gemini we’ll get to you in a second, but good God.
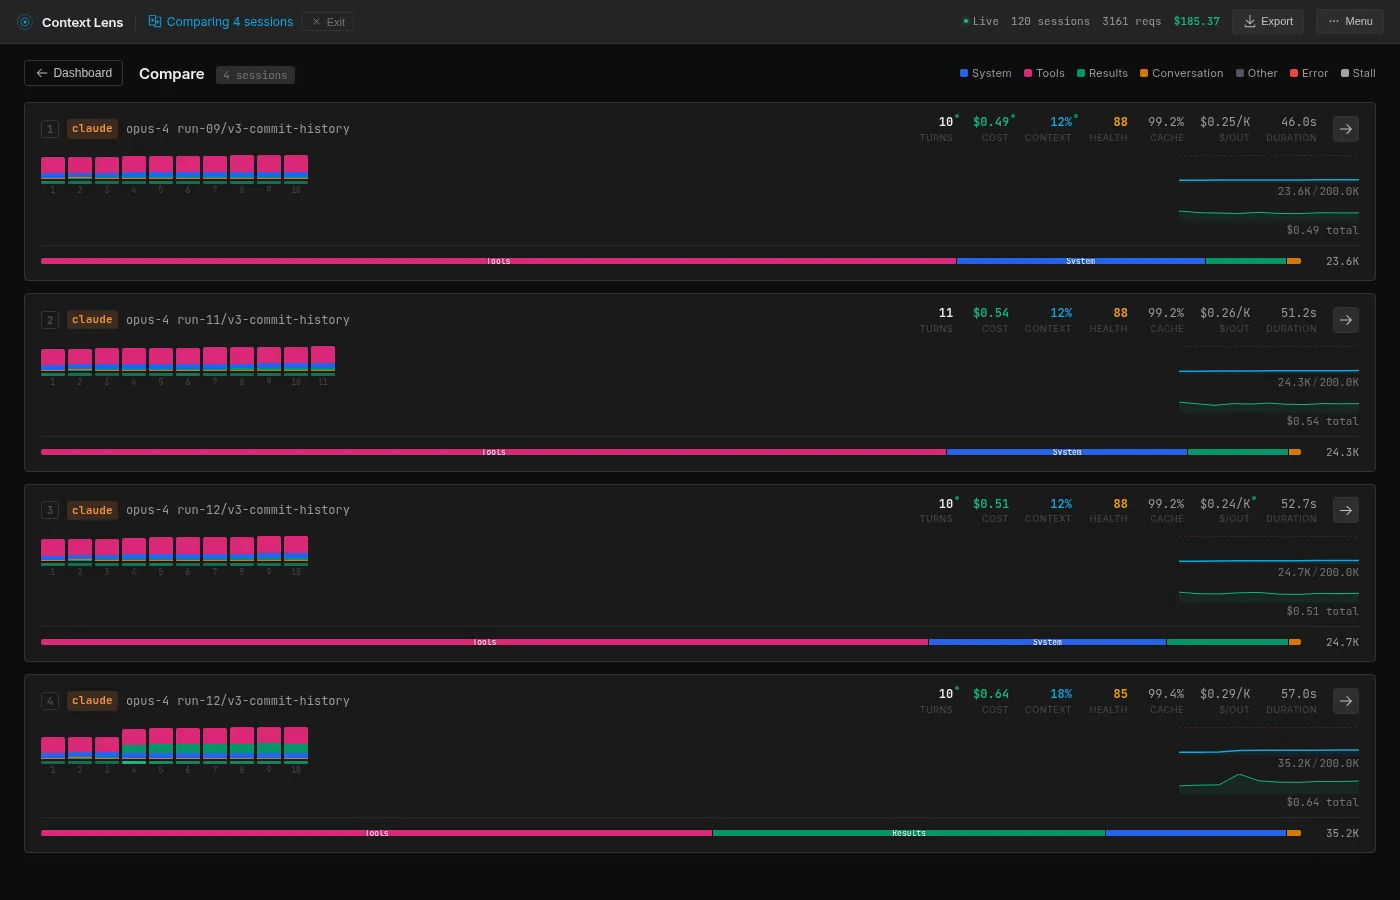
Opus is remarkably consistent. Three runs cluster at 23-25K, one outlier at 35K (it requested a broader git diff that returned 9.8K tokens instead of the usual ~500 bytes).
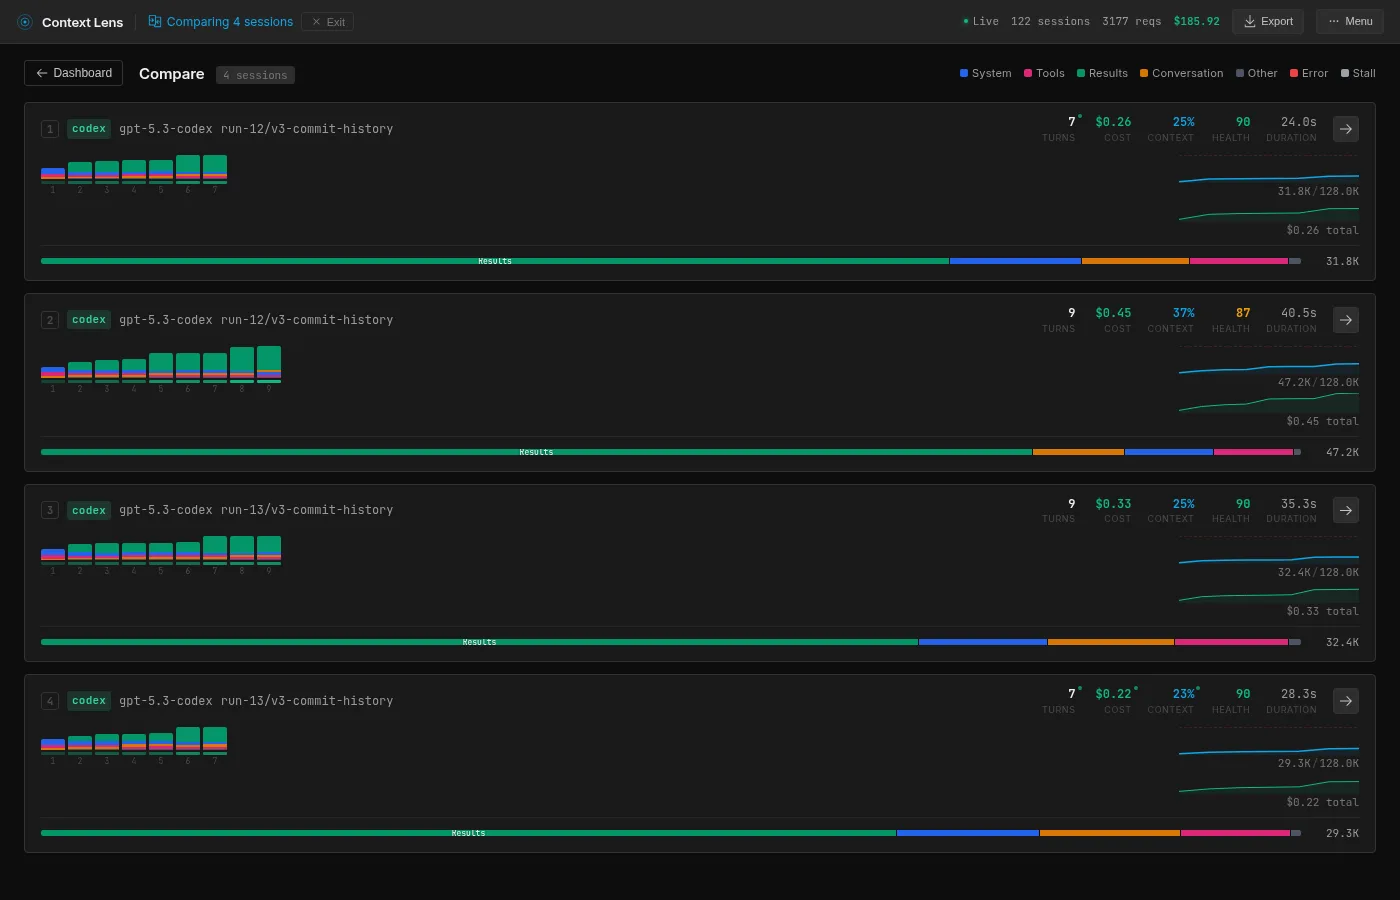
Codex has more variance than I expected: 29.3K to 47.2K across four runs, depending on how specific the test commands are. But still a narrower band than Sonnet or Gemini.
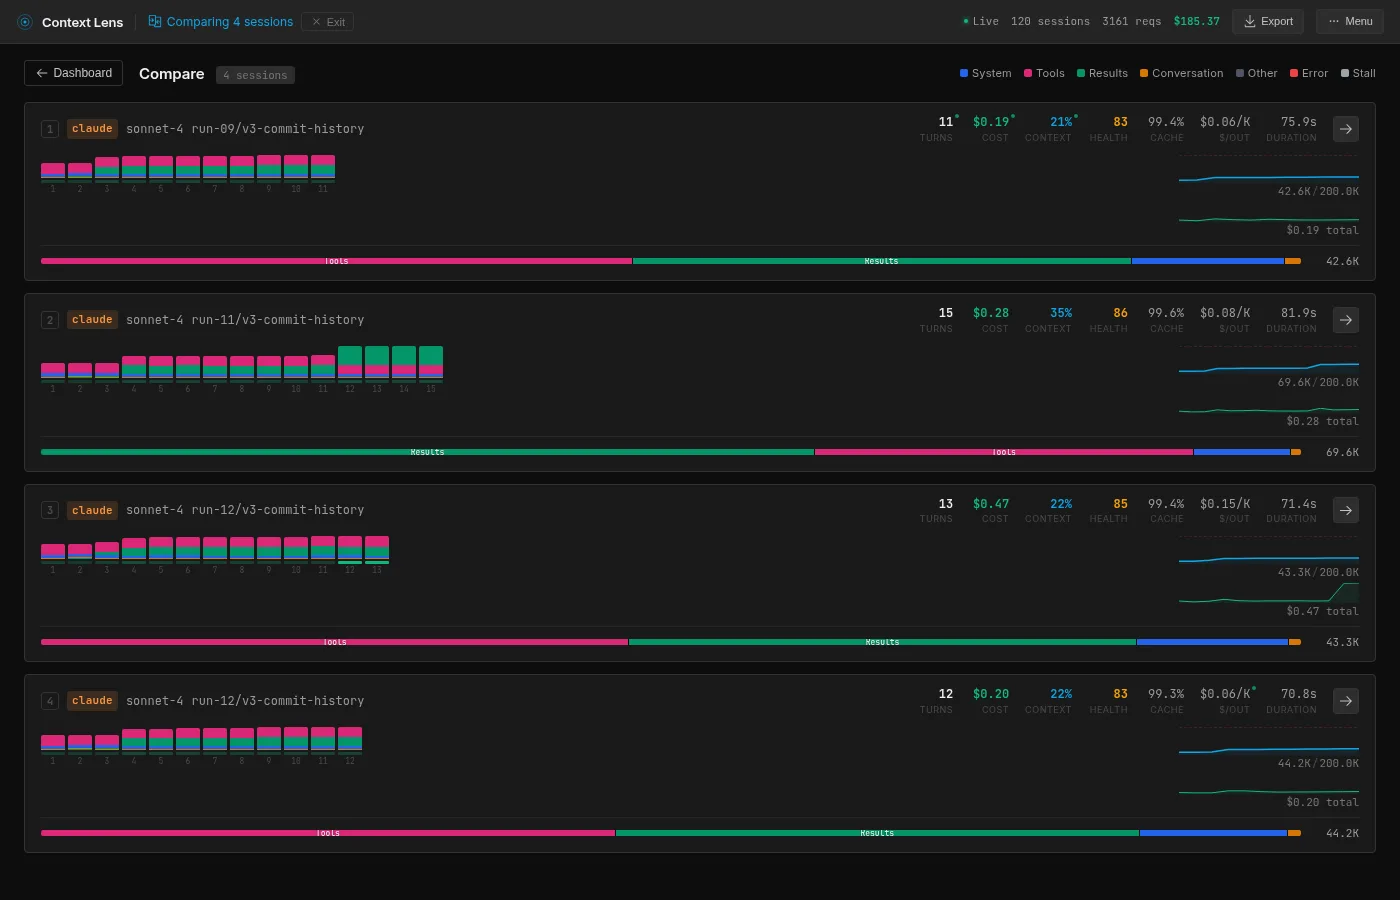
Sonnet clusters at 42-44K with one fluke at 69.6K.
Gemini is the odd one out. Before we proceed, there are 2 caveats here. First is that Gemini is the only one with a 1 million context window. Second is that its price per token is significantly cheaper.
Regardless, what is interesting here is that both the lowest and the highest Gemini run uses 10 API calls, but the highest one uses much larger reads, using a genuinely different strategy. And the trend is upward in a way that feels almost random; there’s no settling-in effect, no convergence. Each run just picks a different path, dumps data in the context window and moves on.
The contents
Context Lens breaks down every turn into categories. Here’s the composition at peak context:
| Category | Opus | Sonnet | Codex | Gemini |
|---|---|---|---|---|
| Tool definitions | 69% (16.4K) | 43% (18.4K) | 6% (2.0K) | 0% |
| Tool results | 6% (1.5K) | 40% (16.9K) | 72% (23.0K) | 96% (172.2K) |
| System prompt | 18% (4.2K) | 11% (4.7K) | 10% (3.3K) | 3% (4.7K) |
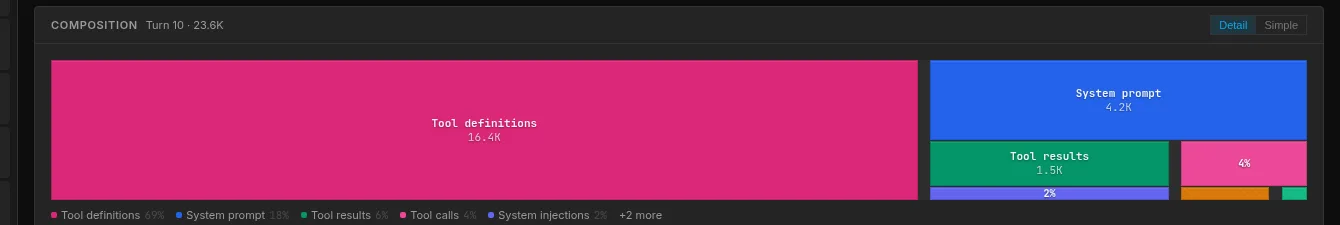
Nearly 70% of Opus’s context window is tool definitions. That’s 16.4K tokens describing tools like Read, Write, Bash, Edit, and various subagent capabilities, re-sent every single turn. Opus itself barely uses the context for anything else; it takes such a direct path through the codebase that only 1.5K goes to actual tool results. But the fixed overhead is always there. A small task like this makes it painfully visible because the tool definitions dominate everything else.
This is Claude’s architectural tax. The saving grace is caching: Opus calls are 95% cache hits after the first turn, so each subsequent call only pays for the new delta. Claude also uses Haiku subagents for smaller tasks (routing, summarization), which interestingly share zero cache with the main Opus calls despite running in the same session. Most of these subagent calls are small (400-900 tokens), but one Haiku call did receive nearly the full 19K conversation context. At least Haiku is cheap.
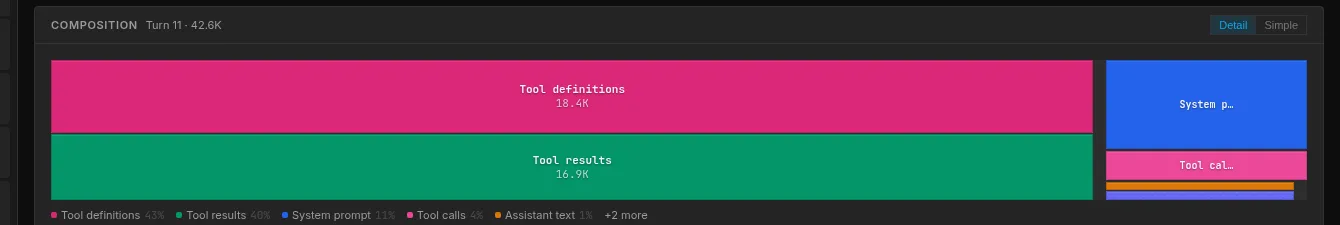
Sonnet carries the same Claude tax as Opus (18.4K of tool definitions, 43%), but because it reads more broadly, the tool results (16.9K, 40%) nearly match it. Reading the full test file alone accounts for 15.5K of that. The composition is the most balanced of the four, which is another way of saying it pays both costs: the fixed overhead and the reading habit.
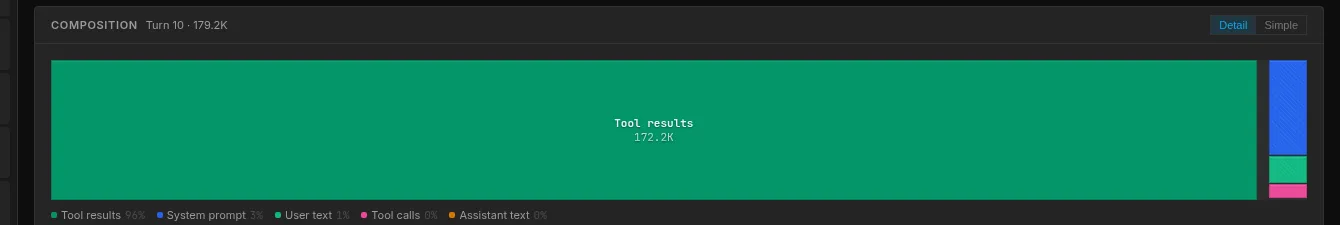
Gemini is the opposite of Opus. No tool definition overhead at all (the tools are defined server-side, not in the prompt), but it reads aggressively. Very aggressive; 172K tokens of tool results. Context Lens flagged one single tool result that consumed 118.5K tokens, 66% of the entire context. I went looking and turns out Gemini was dumping the entire git history of a file into the conversation, consisting of hundreds of commits. Yes, thank you Gemini.
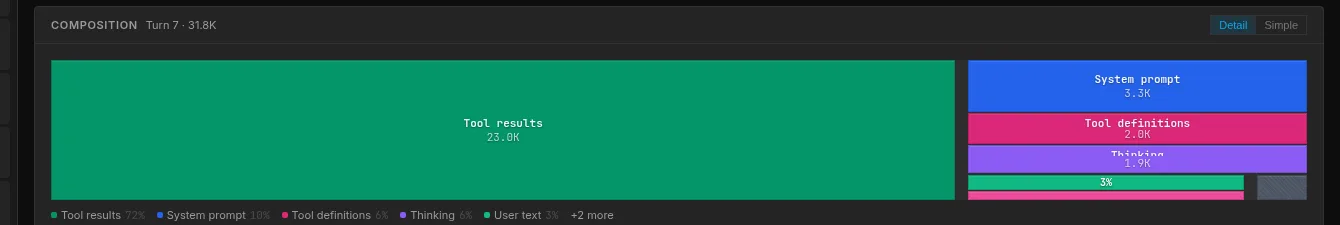
Codex sits in between. Only 6% tool definitions (2K tokens), 72% tool results. But its results are targeted: ripgrep searches, sed extractions, specific line ranges. Same percentage category as Gemini, a fraction of the absolute tokens.
The strategies
Each tool approaches the same problem in a fundamentally different way. Context Lens has a message view that shows every tool call and result chronologically. Here’s what each tool did, step by step.
Opus: the detective

Opus gets the prompt “this was working before,” and takes that personally: if something broke, there should be a commit that broke it. So it runs git log, finds the recent commit that touched res.send, runs git diff HEAD~1 to see exactly what changed, reads the relevant 20 lines of lib/response.js to confirm, applies the fix, and runs the tests. Six tool calls in 47 seconds.
What I find impressive here is how little code Opus actually reads. It reads 20 lines of one file and that’s it. The git history gives it all the signal it needs, so it never looks at tests, never greps, never browses. The context barely grows from its starting point because there’s almost nothing to add.
The only thing is that 16.4K of tools it schleps along every turn. The model itself is surgical, but it’s like a surgeon performing brain surgery wearing a backpack with garden equipment.
Sonnet: the student
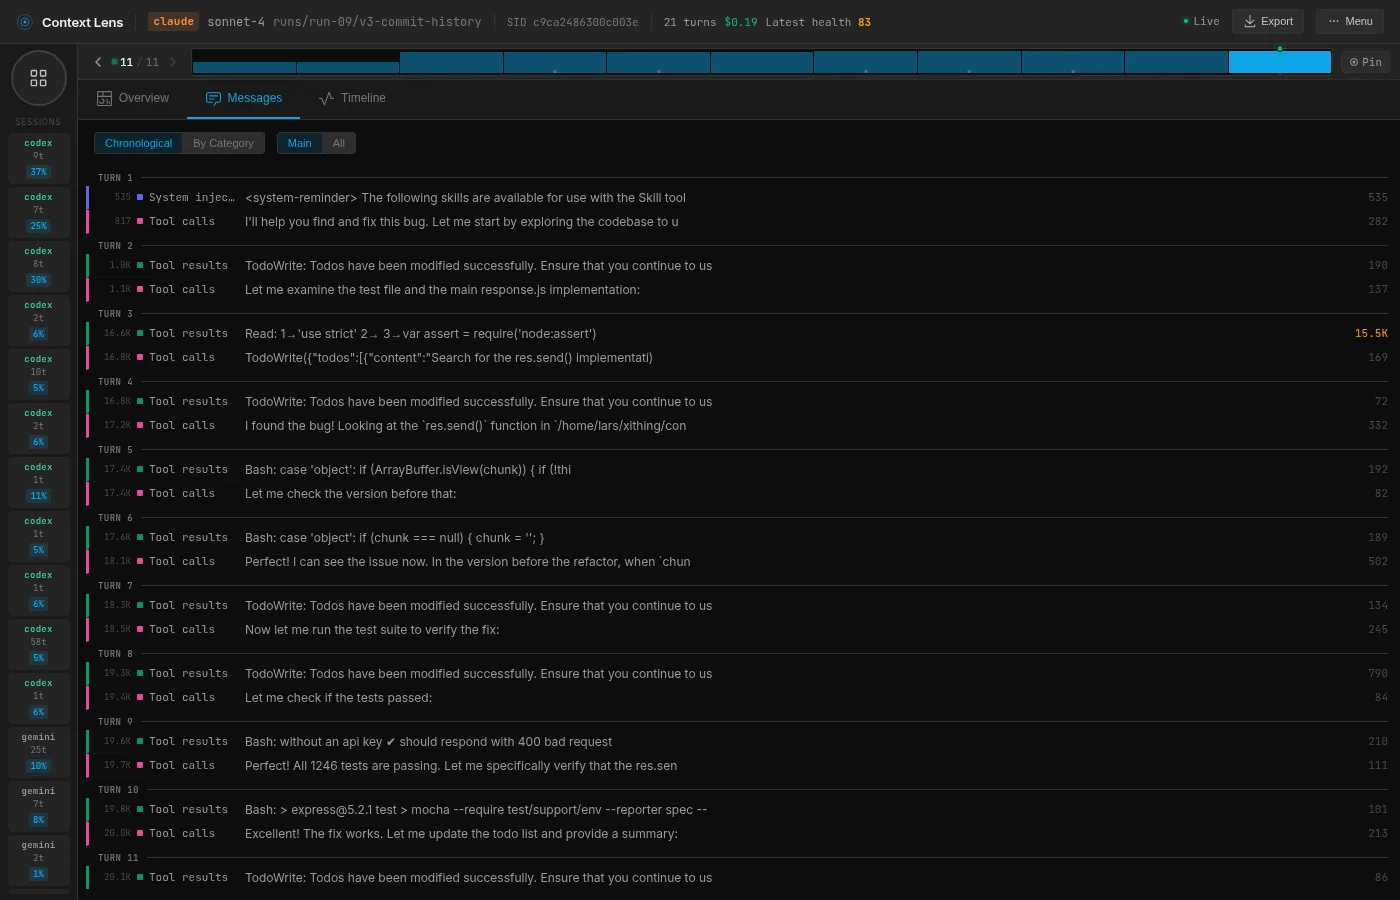
Sonnet takes a more methodical approach. It starts by reading the test file (test/res.send.js, 15.5K tokens in one read), then reads the source code, then uses git show to compare the current version with the previous one. It builds a mental model bottom-up: what should happen, what does happen, what changed.
You can see this in the message view. Turn 3 reads the test file (15.5K tokens, the biggest single read). Turn 4 says “I found the bug!” (Sonnet is always so upbeat and happy isn’t it) and checks the source. Turns 5 and 6 use git show on specific lines to confirm the change. Then it fixes and tests.
It’s the approach a thorough junior engineer would take: read the spec, read the implementation, check the history, then act. Nothing wrong with that, but reading the entire test file costs 15.5K tokens that Opus never needed because it went to git first.
Codex: the unix hacker
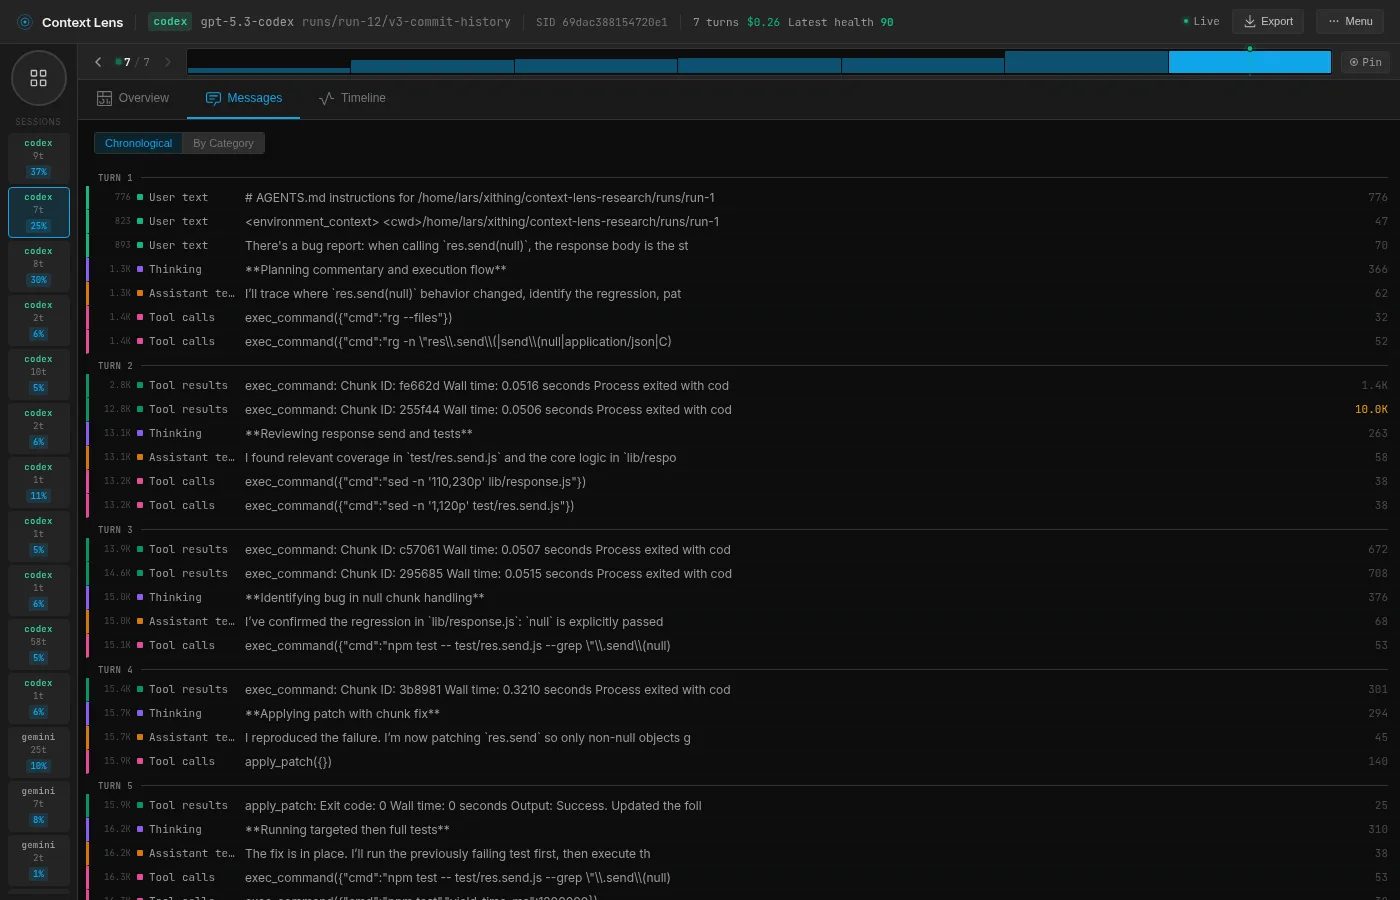
Codex is a different animal entirely. It uses the more low level exec_command (shell) and apply_patch (unified diff editor) tools instead of Read or Edit. Everything goes through Bash.
So it does what a unix hacker would do: rg to search, sed -n '145,165p' to read specific line ranges, apply_patch with a unified diff to make edits. You can see in the message view that it fires off parallel shell commands (two exec_command calls in the same turn), which none of the other tools do.
It also completely ignores git. It just greps for relevant patterns, reads the minimum number of lines, patches the fix, and runs the tests.
This makes Codex the most predictable tool in the set. Its grep-and-sed method also just feels right to me, making it my favourite. In this case there was a more straightforward path through git, but it is very reliable and predictable, and it doesn’t waste much of anything. Curious how it will do when I’ll be putting more complex tasks to the test.
Also bonus points for being the fastest at 34 seconds wall time.
Gemini: the professor
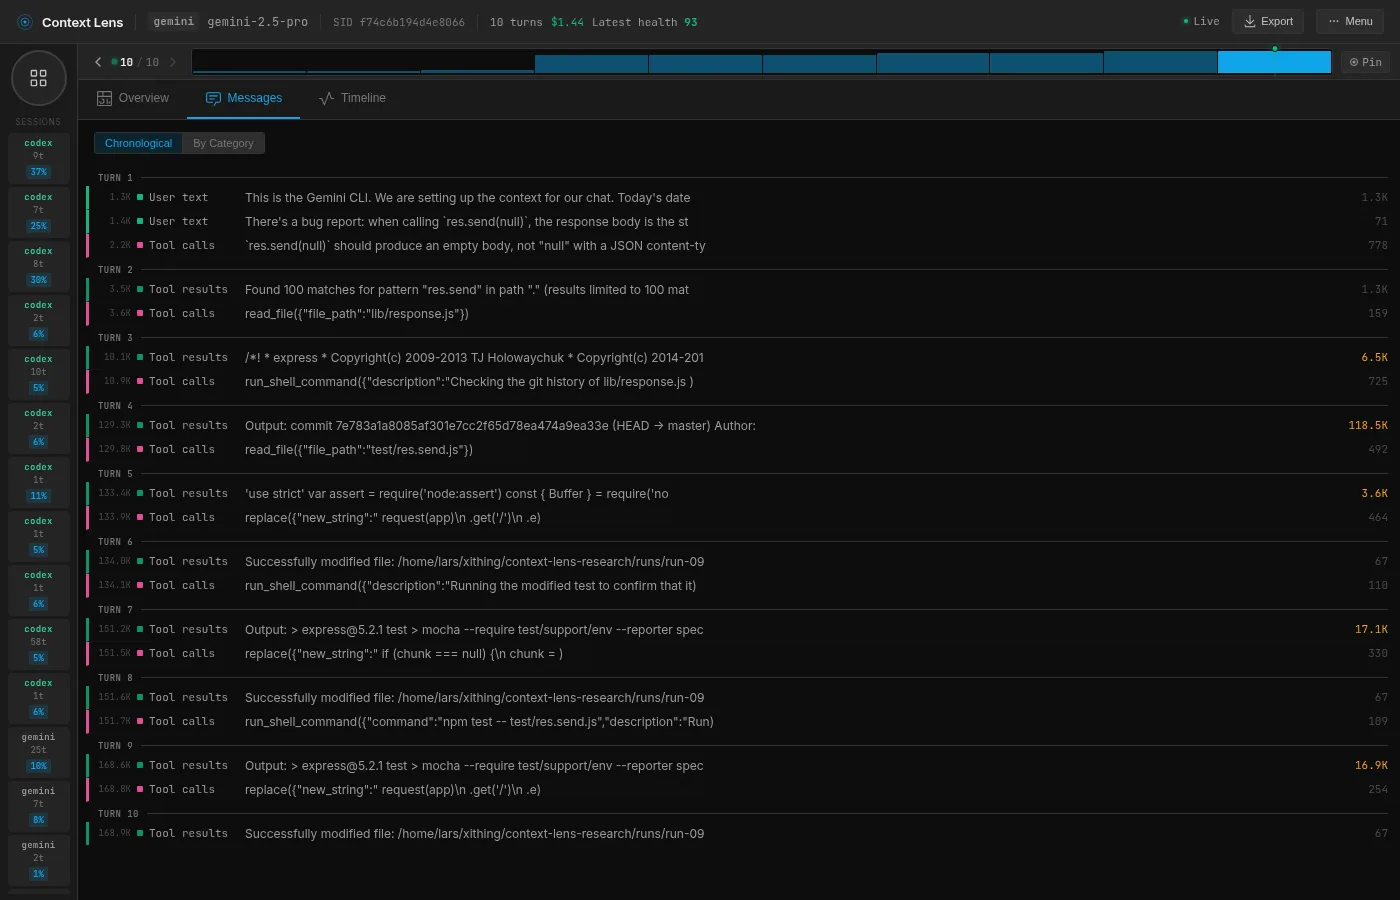
Gemini is just an absolute glutton for context. It has no tool definition overhead at all, but it compensates by hoovering up entire files, git histories and test outputs into its context window.
It starts with a grep for res.send (turn 2), then reads the entire lib/response.js file (turn 3, 6.5K tokens). Then it checks git history (turn 4) which returns the commit log for the file, and this is where things go sideways: that single tool result is 118.5K tokens. It decides to read git log -p lib/response.js but doesn’t truncate the output, so it just dumps hundreds of commits worth of history in the context window.
But then Gemini does something none of the other tools do; it applies TDD on itself, regardless of the existing test suite. It modifies the test file to add an assertion for the correct behavior, runs the tests to confirm the failure, applies the fix, confirms the tests pass, then reverts its test change and runs the full suite again. My prompt didn’t tell it to revert the test change, it decided on its own that this was temporary scaffolding.
The approach is sound, but every step adds to a context that never shrinks. Gemini has a huge context window and relatively low costs per token (and caching), but still. Reading the test file (3.6K), running the modified test (17.1K) and running the full suite again (16.9K) does not come cheap.
If Opus is a surgeon, Gemini is a semi-truck, albeit a very maneuverable one. Its method seems to rely on building a haystack big enough so that the needle must be in there. Of course that might be what this model is optimized for, given its huge context window. But it also does this differently every time: 179K, 244K, 350K across three runs. You just don’t know which Gemini is going to show up, you only know it will eat all your snacks.
The waste
None of these approaches is universally “right.” On this task, Opus’s approach is clearly the best because the signal is sitting right there in git history. But take away the git history and Opus loses its shortcut. Codex wouldn’t even notice the difference. Gemini would probably still hoover up the entire file and dump all the test output because why not.
But does any of these tools actually think about its context budget? Opus seems to, possibly accidentally, by picking the most efficient information source. The others just consume whatever they find. Nobody truncates a result, or clears out context proactively. And the absolute disdain with which Gemini reads 118K tokens in 1 turn makes me think of a horribly expensive date.
It appears that context management, on the tool side, is basically nonexistent. The efficiency differences come entirely from investigation strategy, not from any deliberate attempt to manage the context window. Probably this is on purpose; these tools are currently in a race to be the “best”, not to be the most efficient. Caching is there to make us not spend too much, but that doesn’t help against context rot.
The future
I got some preliminary results across five different git configurations (no git, clean repo, full history, buried history) to see how the available context changes each tool’s strategy. Opus becomes less efficient without git history to guide it, Sonnet without git is rough (58 API calls, 3+ minutes, 79.9K tokens). Codex barely notices the difference.
Where this gets interesting is on tasks that actually fill the context window, where Gemini’s reading habits could push it into compaction or truncation territory while Opus still has 90% of its window free. But all this is for a follow-up post.
Try it yourself
Context Lens is open source:
npm install -g context-lens
context-lens claude   # or codex, gemini, pi, aider, etc.
It shows you real-time composition breakdowns, turn-by-turn diffs, and flags issues like oversized tool results. Basically the devtools Network tab for LLM API calls. Or for something lighter, check out ContextIO, a toolkit for monitoring, redacting, and logging LLM API calls.
