Five CLIs Walk Into a Context Window
Claude Code sends 62,600 characters of tool definitions to the model on every turn. pi sends 2,200. Aider sends zero. I know this because I intercepted all of their API calls while they were fixing the same bug, with the same model, on the same codebase.
This started as a follow-up to my earlier research where I compared four different models on a standardized coding task. That experiment showed huge differences in context usage between tools, but it was hard to separate the model’s behavior from the wrapper’s overhead. If Claude Code uses 70% of its context on tool definitions, is that a Claude problem or a Claude Code problem?
The only way to find out was to hold the model constant and swap the wrapper. So I ran Sonnet 4.6 through five different CLIs, three times each, and traced every request.
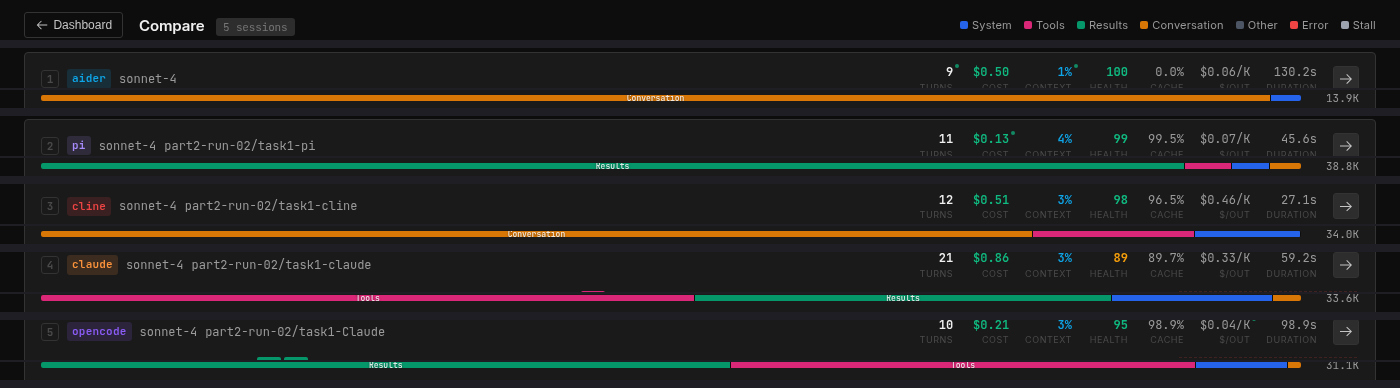
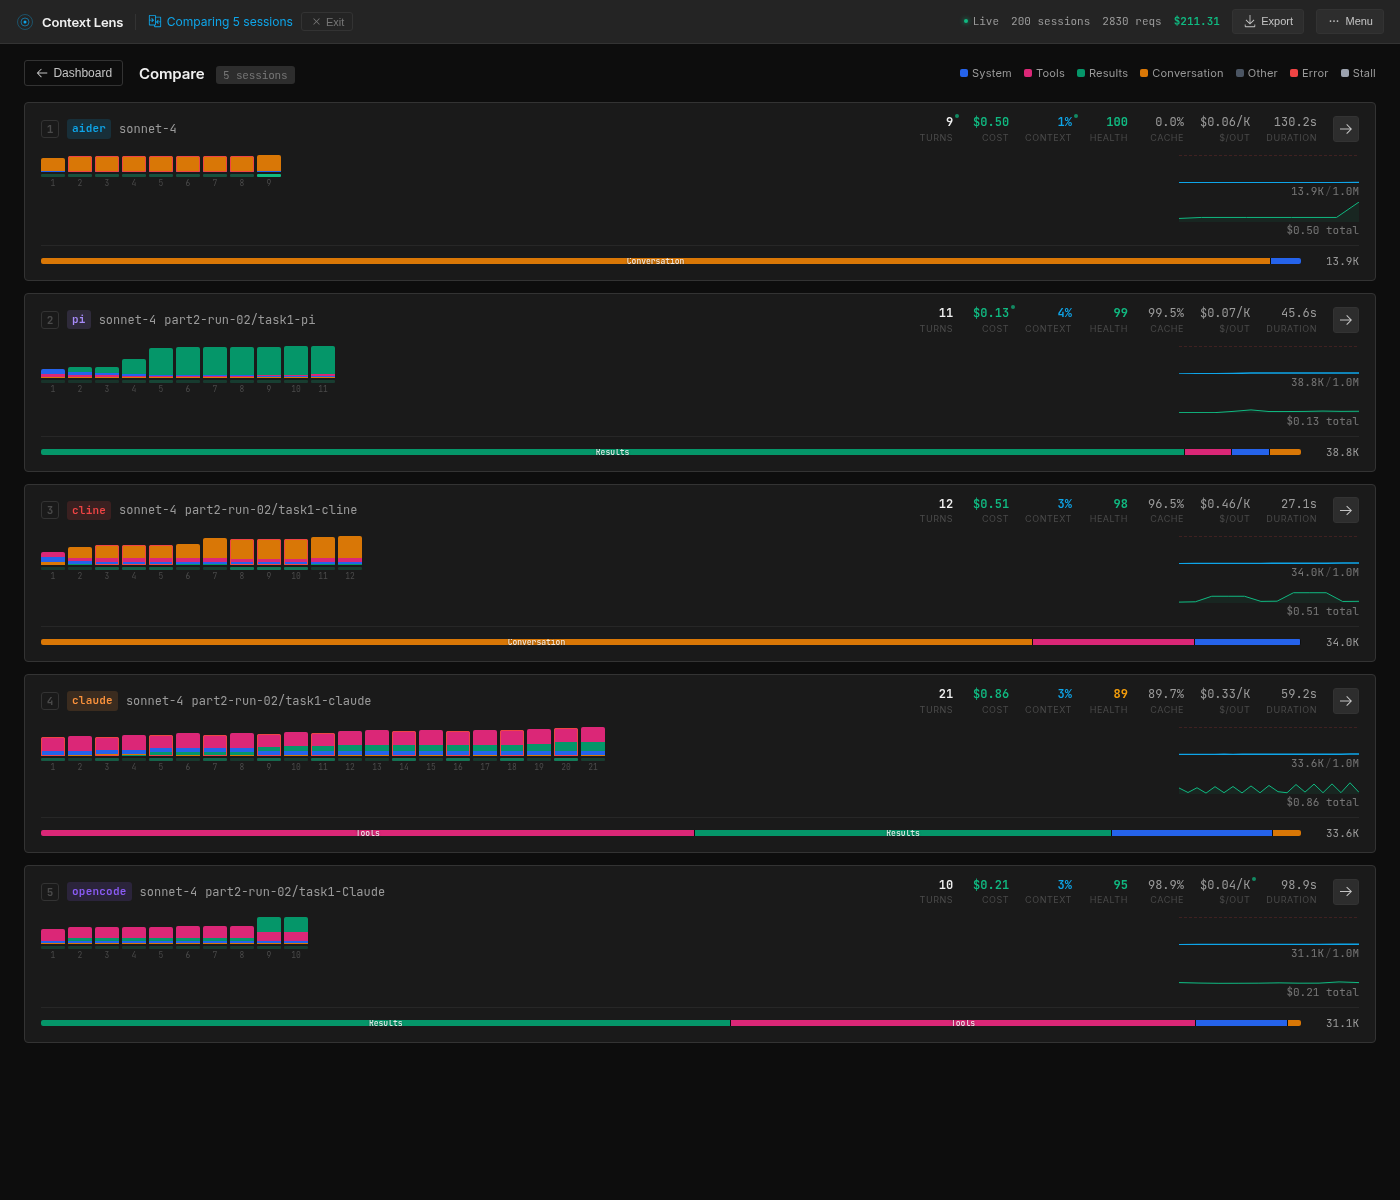 All five CLIs compared in Context Lens. Same model, same task, five completely different context profiles.
This is Part 2 of my context tracing experiments with Context Lens. In Part 1, I compared four different models on the same task and found that investigation strategy drove most of the context differences. This time the question is narrower: if we hold the model constant, how much does the wrapper matter?
The Setup
Quick context if you missed Part 1: there’s a planted bug in Express.js where res.send(null) returns the string "null" with content-type: application/json instead of an empty body. Each tool gets the same prompt, the same repo with 6,132 commits, and the same pre-installed dependencies.
The five wrappers span the full spectrum of how you can talk to a model:
pi is four tools and nothing else. Read, Bash, Edit, Write, described in 2,200 characters total. The smallest toolset I’ve seen in any serious coding CLI. It’s a lean, mean, coding machine.
Aider is the purist. No tools at all, taking minimalism to the extreme, like one of those ultralight backpackers. It sends a “repo map” (summaries of every file in the project) and the user’s prompt as plain text, and the model responds with the complete updated file. No function calling and no iteration.
Cline has 11 tools and a large system prompt, but does something unusual. Where most wrappers put file contents in tool_result blocks, Cline puts them in user messages with injected <environment_details> metadata. It’s like Cline built its own protocol on top of the Anthropic API, which means the conversation structure looks fundamentally different from the other wrappers.
Claude Code hauls along 18 tools at 62,600 characters. This includes TodoWrite (10.5K chars), Bash (12.7K chars), Task (8K chars for launching sub-agents), and a collection of planning, worktree, and notebook tools that get sent on every turn regardless of what you’re doing.
OpenCode has 10 MCP tools at 22,100 characters. Its bash tool alone is 10.7K characters, nearly five times the size of pi’s entire tool set.
| Tool | # Tools | Tool Defs | System Prompt |
|---|---|---|---|
| Aider | 0 | 0 | 1.3K |
| pi | 4 | 2.2K | 4.2K |
| Cline | 11 | 13.5K | 11.1K |
| Claude Code | 18 | 62.6K | 15.6K |
| OpenCode | 10 | 22.1K | 1.6K |
The composition
If you open these sessions in Context Lens, the composition bars tell the story before you read a single number. Each wrapper produces a visually distinct pattern (see the horizontal bars in the screenshot above):
- Aider: a solid block of orange (user text, 96%). Almost nothing else.
- pi: a solid block of green (tool results, 91%). The model reads files and runs commands; that’s what fills the context.
- Cline: mostly orange (user text, 75%) because tool results are encoded as user messages, with a smaller pink band (tool definitions, 12%).
- Claude Code: dominated by pink (tool definitions, 55%) with green (tool results, 22%). More than half the context is describing tools.
- OpenCode: a large green block (tool results, 71%) with a visible pink band (tool definitions, 24%). The model does a lot of reading.
Cline does something architecturally different from everyone else: it encodes tool results as user messages rather than using Anthropic’s native tool_result content blocks. So what Context Lens classifies as 75% “user text” is actually file contents and command output stuffed into the user role, with <environment_details> blocks injected on every turn showing the current time, visible files, and task state.
The numbers
All five tools solved the bug, mostly at least. Aider got it wrong once out of three tries because it can’t run tests to verify its fix. Everyone else went 3/3.
| Tool | Turns (Main) | Peak Context | Output | Cache % | Cost | Pass |
|---|---|---|---|---|---|---|
| Aider | 8.0 (3.0) | 13,808 ±53 | 8,669 | 0% | $0.23 | 2/3 |
| pi | 8.0 (8.0) | 39,713 ±10,774 | 1,412 | 71% | $0.21 | 3/3 |
| Cline | 12.7 (6.7) | 33,981 ±6 | 1,135 | 78% | $0.18 | 3/3 |
| Claude Code | 21.0 (12.0) | 31,966 ±5,305 | 2,737 | 92% | $0.21 | 3/3 |
| OpenCode | 17.3 (16.3) | 34,506 ±5,316 | 5,421 | 81% | $0.36 | 3/3 |
Not all turns are shaped equally. Aider’s extra turns are retries and commit message generation. Claude Code’s include cheap Haiku sub-agent routing calls. Cline’s include environment probes. “Main” counts only the turns where the model is actually working on the task.
Cline is cheapest, OpenCode is most expensive at nearly 2x, and the rest cluster around $0.21-0.23.
The highlights
A couple of things jump out here.
Aider’s context is tiny but its output is enormous. 13.8K tokens in, 8.7K tokens out. Because it doesn’t use tools, it returns the entire modified file as text in its response, where every other tool uses an Edit or apply_patch operation that only costs a few hundred tokens. Aider also has zero cache hits because it doesn’t use Anthropic’s prompt caching at all, which means it pays full price on every single turn.
Claude Code takes the most turns but not the biggest context. 21 turns average, but the context peaks at 32K because around 9 of those turns are sub-agent calls. Claude Code uses a two-model architecture: a small Haiku classifier decides which requests need the main model and which can be handled cheaply, so those 9 turns are tiny routing calls with contexts under 2K. The main Sonnet turns are 10-13 per session, which is comparable to the others.
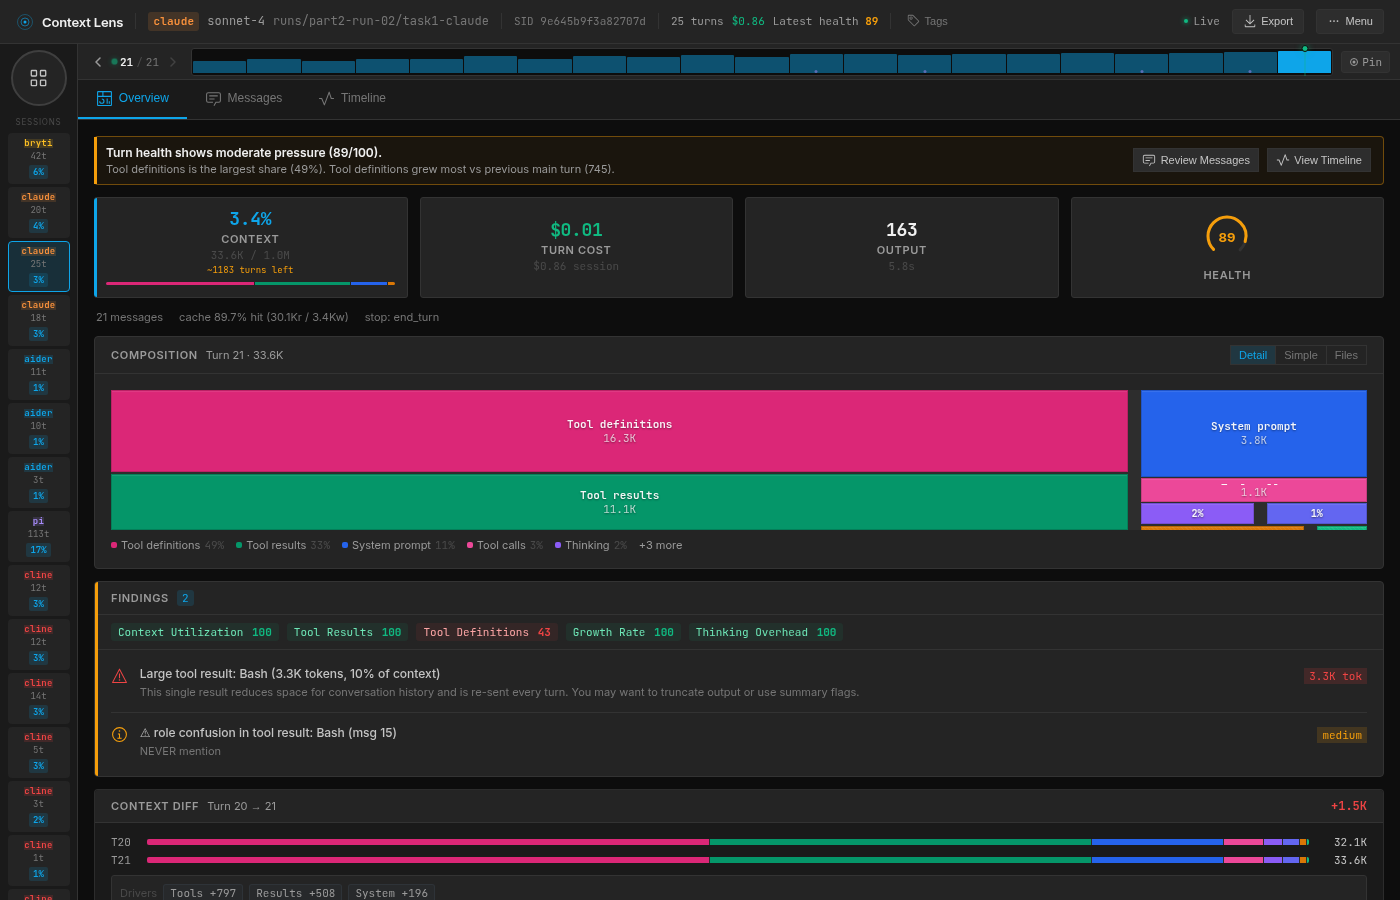 Claude Code: tool definitions dominate the composition bar, sub-agent turns visible as small blocks
OpenCode is the most expensive despite using the same model. $0.36 per session versus $0.18-0.23 for everyone else is significant. The culprit is output tokens: 5,421 on average, nearly four times what pi and Cline produce. The model tends to be more verbose when talking through OpenCode, and verbose responses get re-sent as conversation history on every subsequent turn, compounding the cost.
Cline is the cheapest and the most consistent. $0.18 per session with essentially zero variance on context size (±6 tokens) is genuinely impressive. I added Cline here for no specific reason other than that the CLI was relatively new, but it’s a really cool result. It achieves this because its architecture front-loads the context with stable user messages that cache well, hitting 96.4% cache on the last turn. Probably the most thoughtful context-management approach of a wrapper I’ve seen yet.
The one that can’t check its work
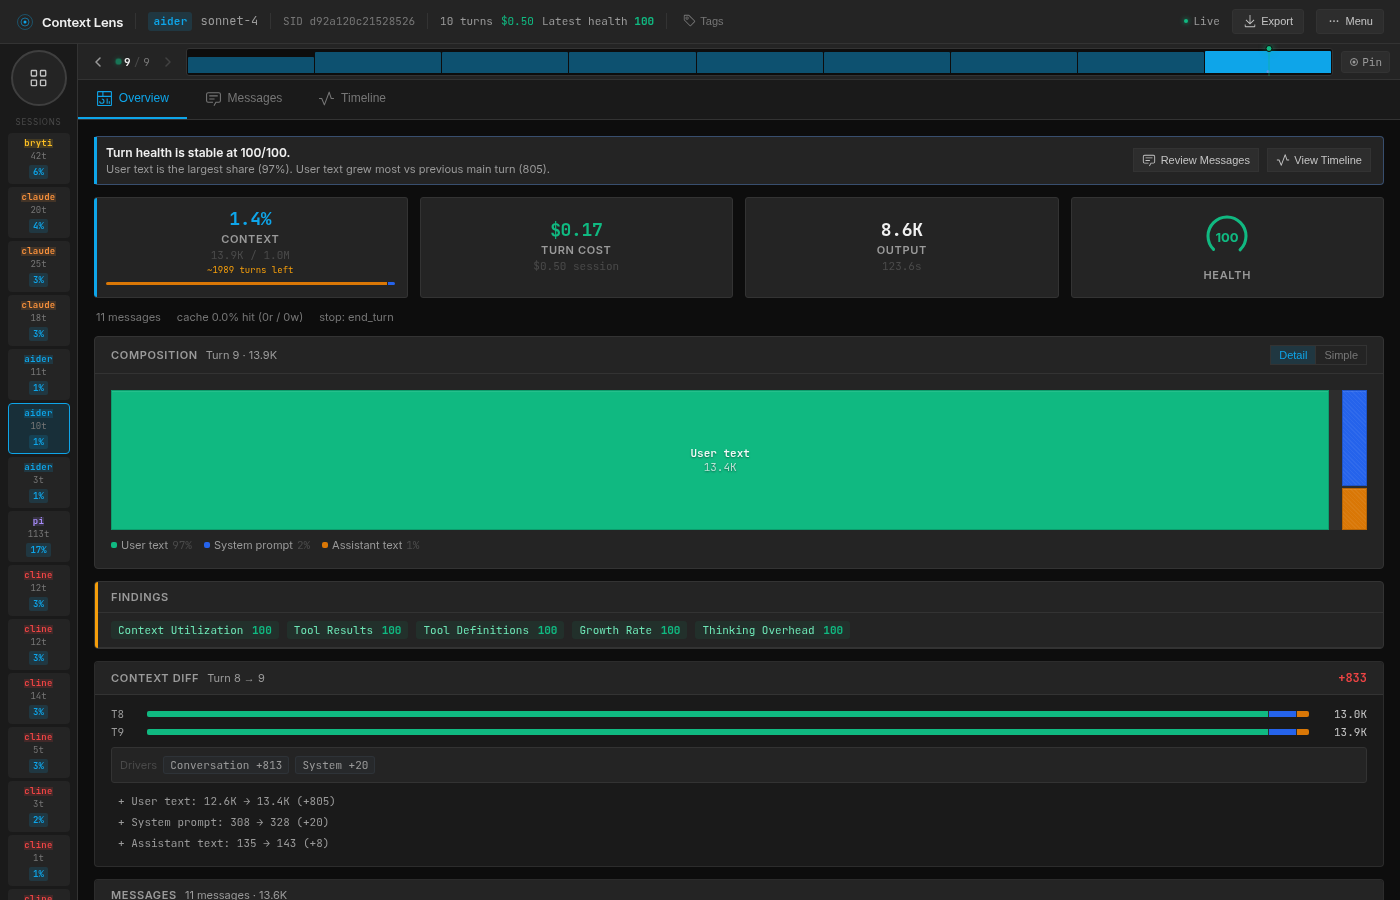 Aider: 96% user text, 0% cache hits, 8.7K output tokens
Aider’s 2/3 pass rate is architectural. No tools means no shell access, which means no way to run the test suite. In run 1, the model produced a fix that looked perfectly reasonable: it moved the null check above the ArrayBuffer.isView check and added a break. But the break skipped setting the body to empty string, so the response came back with Content-Length: 1891 instead of 0, which is one failing test out of 1,248.
It’s not “bad” or “wrong” though. When using Aider, you’re probably used to running your own verification, and you’d get Aider to fix it afterwards. It does skew the experiment slightly; the actual context usage would be higher after a reprompt.
The variable piece of the pi
I traced pi’s large variance to a single decision per run. In pi run 1, the model reads lib/response.js, spots the bug, fixes it, runs the tests. Six turns, 29K context.
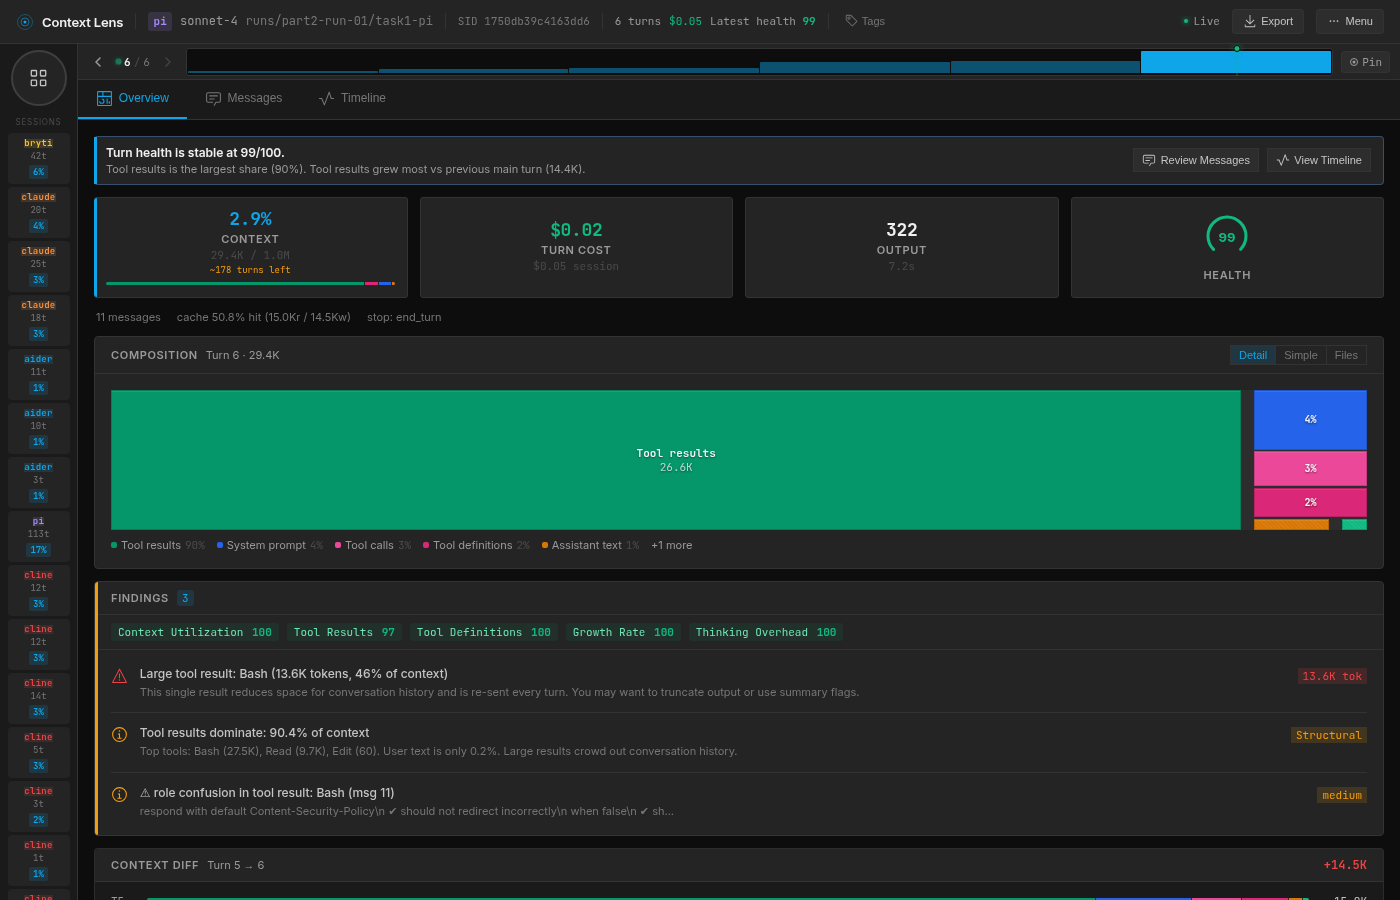 pi run 1: surgical, 6 turns, 29.4K context
In run 3, the model decides it wants to check the git history first and runs git log --oneline. On a repo with 6,132 commits, that returns 52,662 characters of output, all of which gets appended to the context. The model still fixes the bug in 7 turns, but the peak context is 51K because of that one command. If you read Part 1 where I evaluated different models, you’ll remember that Gemini used to do the same (but consistently).
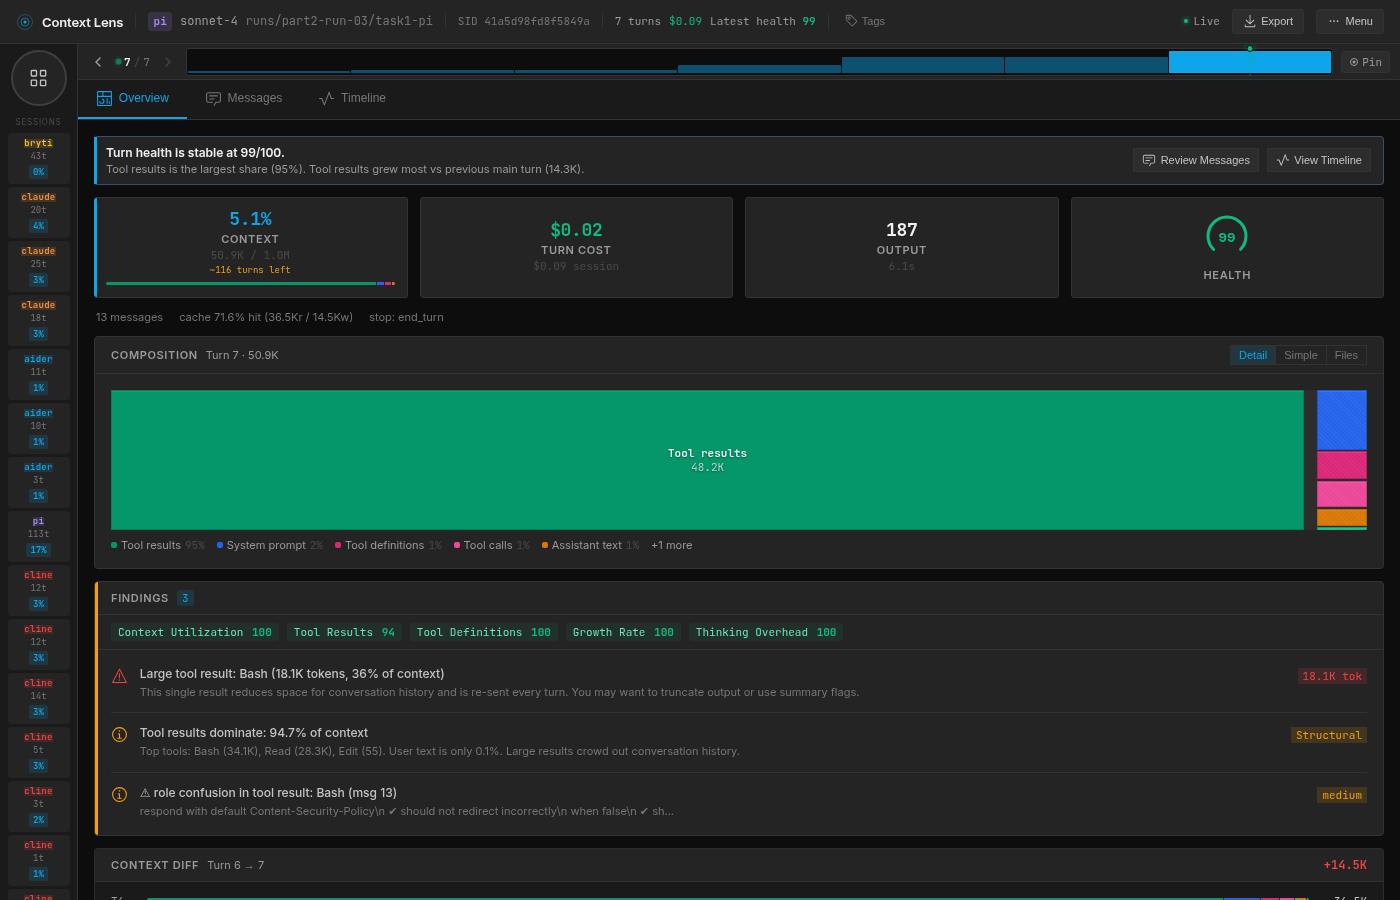 pi run 3: one git log command inflates the context to 50.9K
Claude Code has lower variance (±5,305) partly because its tool definitions act as ballast. When 62.6K characters of your context is fixed scaffolding that never changes, the model’s exploration choices become a smaller proportion of the total. pi starts lean, so one large tool result swings the whole profile.
The chatty model problem
OpenCode costs nearly twice what the others do, and the reason is purely output tokens. The model generates 5,421 output tokens per session through OpenCode, versus 1,135 through Cline and 1,412 through pi. And since output tokens cost 5x more than input tokens on Sonnet 4.6, this dominates the bill.
I dug into OpenCode’s Anthropic system prompt, and it includes multi-paragraph examples that teach the model to narrate every step (“I’m going to use the TodoWrite tool to write the following items… marking the first todo as in_progress… The first item has been fixed, let me mark the first todo as completed, and move on to the second item”). The model dutifully mimics this verbose narration style on every turn. The wrapper literally teaches the model to be chatty, and chatty output tokens cost 5x more than input.
I have no clue why; maybe it forces consistency across different models, or maybe it was written for less capable models and ported to Anthropic without much thought. I’d love to hear the reason.
The quiet MCP problem
When I first started this experiment, Claude Code showed 22 tools instead of 18. I had Tether (a chat bridge I built for agent communication) registered as an MCP server, and its four tools were silently included in every request. They only added 2K characters, which is why I didn’t notice until I looked at the raw payloads.
After removing them and re-running, the numbers barely changed, but the principle matters: MCP servers silently add to your tool overhead, and you might be carrying (and paying for) tools you forgot you installed.
The wrap-up
It’s fascinating to see how wrappers shape the context. I honestly didn’t expect so much variation given the same model. But of course, on a relatively small task like this, everyone wins, participation trophies all around.
The open question is what happens when context windows get tight. Compaction needs to make harsh choices, and if Claude Code is carrying 62.6K of tool definitions, it has less space to store info from a long-running session. pi’s 2.2K of tools would leave an extra 60K tokens for conversation history and actual context.
Regardless, if you’re interested in cost optimization, you might reconsider your choice for OpenCode on models that charge per output token, or at least you might be inclined to analyze usage yourself. And if you need predictability, you could take another look at Cline. I know I will be doing that for sure, even though pi is my daily driver.
I’m working on a larger experiment to pressure context windows, but it’s quite some work, which is why I squeezed this one in first. You can try Context Lens yourself, though I should warn you: once you see what’s in there, you can’t unsee it.
